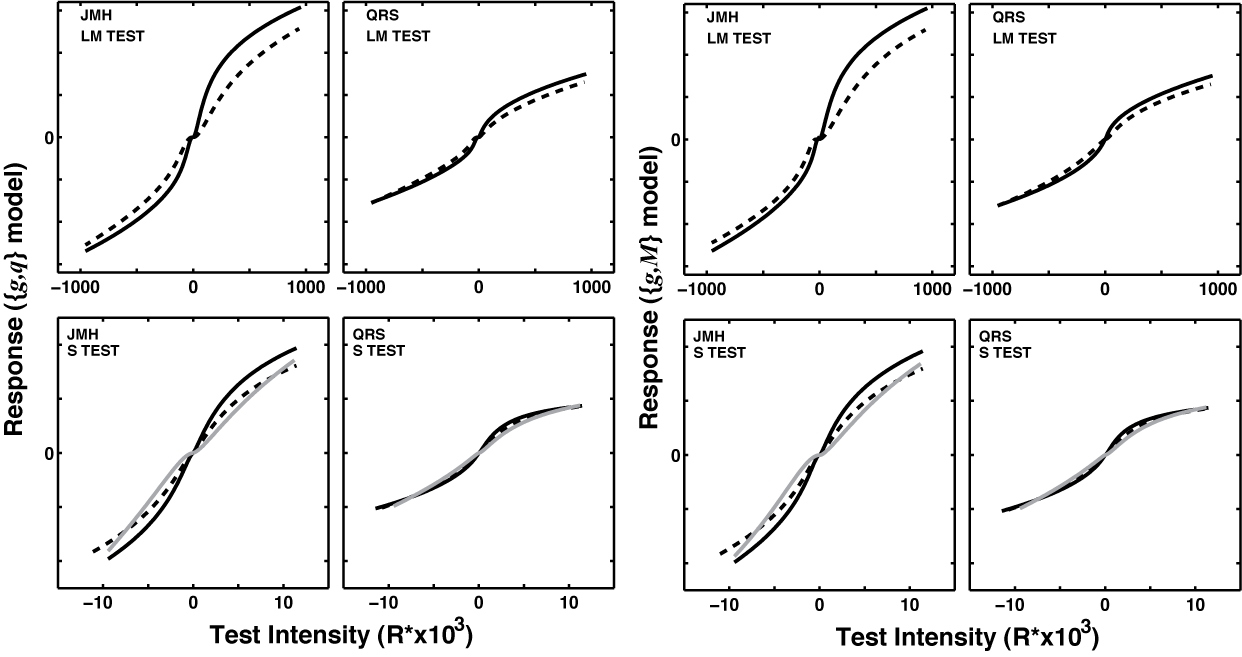
Supplemental Figure 2: Response Functions for {g,p} and {g,M} fits of the Common Mechanism Model
Response functions for {g,p} and {g,M} fits of the Common Mechanism (CM) variant. The x-axes show stimulus intensity (expressed as a difference from the background) and y-axes show response magnitude. The four plots grouped on the left show response functions for the CM variant of the {g,p} adaptation model. The four plots grouped on the right show response functions for the CM variant of the {g,M} model. JMH's and QRS's response functions are in the left and right sides of each group respectively, and response functions for increments and decrements are shown together in each plot. Over the range of stimuli we employed, these two parametric models yield essentially identical response functions. (Back to main supplemental figure page)
