Erratum: Figure 1 of Delahunt and Brainard (2000, Control of chromatic
adaptation: signals
from separate cone classes interact. Vision Research, 40, 2885-2903.)
There is a didactic problem with Figure 1, which was intended to illustrate the general logic we employed in the studies. Unfortunately, the figure shows a particular illustrative example that, although it does show the logic, does not properly depict the L, M, and S cone planes of any actual stimuli used in the experiments.
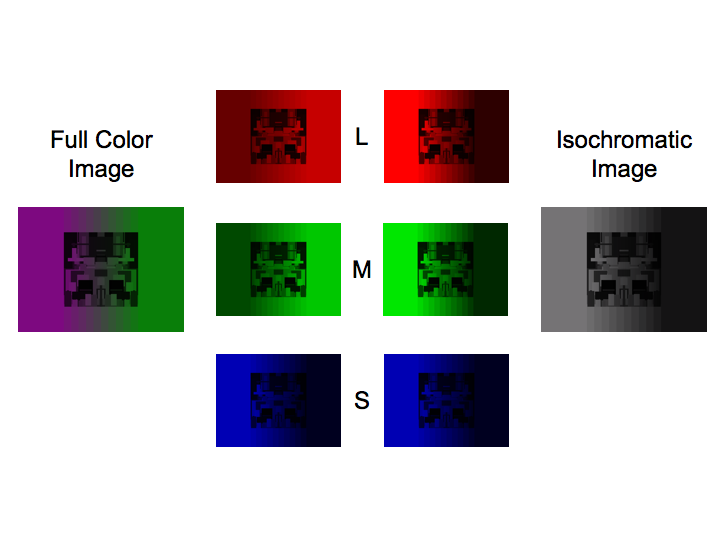
The purpose of Figure 1 is to illustrate the general logic of the experiment, which goes as follows. Choose any L, M, and S cone contextual image planes that you like. As we note at the top of the right column of 2887, there are basically no constraints on the properties of these image planes -- you could even have different spatial structure in each plane. Combining these three planes then produces the "full color image". The manipulation is then to change the L and/or M cone planes while leaving the S cone plane alone. For our purposes, any change of L and/or M cone plane will do, it is not logically necessary that the result be isochromatic. But for convenience, and because it produced clear effects, the way we actually implemented the manipulation to make the final image isochromatic. This was easy because the manipulated L and M planes were just scalar multiples of the original S cone plane. The center two columns of Figure 1 are consistent with this logic. Notice also that this logic works perfectly well even if the L and M cone planes both increase from test-to-match.
The didactic problem is that one might reasonably infer that the particular manipulation we used in Figure 1 was also used in one of the experiments, particularly given the wording of the figure caption. But the figure is not quite what we intended. The full color and isochromatic images shown in the left and right columns of the figure are correct (up to the vagaries of color reproduction) representations of the stimuli used in Experiment 1. But the three cone plane images shown for the full color image are wrong. These depict the red, green, and blue phosphor image planes for the image. That is, when we made the images for representation, what we should have done was convert the full color image from the RGB monitor space (which is the right representation to produce the displayed full color image) to the LMS cone space and then shown each of the L, M, and S planes in the figure. It turns out that for the image shown, the L and M cone planes have their gradients in the same direction, as described in the text and shown numerically in Table 1. In the figure they are depicted as having gradients in the opposite directions. It may seem a bit counter-intuitive that the L and M planes could have their gradients in the same direction while R and G planes have their gradients in opposite directions. But if the slope of the gradient is different in the L and M planes (which it is, see Table 1 and also the data figures, which show the slope of the test-to-match gradients) then in fact this can happen when you do the color space conversion from LMS to RGB.
A corrected version of the figure is provided below, without the white squares indicating the position of the test and match stimuli. This version matches the caption and is what we should have published.
The error in figure one has no implications for the data or conclusions published in the paper.
Thanks to Jim Schirillo for bringing this error to our attention.